Strategies for Beats

It has been quite some time since I wrote about Spotify and Beats, so let’s briefly step aside from the automotive and tech posts and into music. Some fairly important news got lost in the Apple Watch shuffle last week — music labels aren’t willing to go below $9.99 per month for music streaming. The most interesting information is tucked away in the last paragraph of the Billboard article (emphasis mine):

There’s also an element of geopolitics at play. A weakened Spotify could help create a more powerful Apple subscription service. That would remove the comfortable, valuable counterweight to Apple that labels don’t have in the digital download space. There’s even some doubt that Apple is out to beat Spotify rather than grow the music subscription marketplace. “If they’re out to kill Spotify, it’s news to us,” says an industry source. "And it’s the last thing we want. We want Spotify to be a strong competitor.

Spotify is king when it comes to music streaming — it has around 15M paying subscribers, and 60M free users. Probably the most important variable to Spotify’s growth is that it allows you to use the desktop apps for free, which is always the preferred option. Spotify is available in most countries and practically on every platform. It was also one of the first entrants in the play-on-demand business (Pandora doesn’t allow for this), which undoubtedly gave it a first-mover advantage in terms of total users. 

Unlike what smartphones have become today, music streaming is a luxury that not every person needs. Therefore, the total market size for paid-for music streaming is quite limited. Although Spotify + Rdio + Deezer + Rhapsody have much more room to grow their paying subscribers, that growth is slowing down. The best way for Beats to grow is either to convert existing iTunes users into paying subscribers (a challenge made even harder if that user is already paying for a competing service), or to steal market share away from Spotify/Rdio/Deezer/Rhapsody. The best way to steal market share would be to offer Beats at a lower monthly price ($7.99), which reports suggest Apple has tried to do and failed. The music industry doesn’t want to make the same mistake as it did with iTunes, which allowed Apple to become a monopoly on music sales. The more competition exists, the more bargaining power the music labels have over steaming services. Since it is unlikely Apple will convince the labels to a lower price tier, Apple must find a different way to grow the Beats brand into the next iTunes. Here are some strategies I would advise Apple to partake with Beats (preferably more than one):

#1 Take the hit

Just because the music labels won’t go lower than $9.99 doesn’t mean Apple can’t. There is always the option of taking the difference ($9.99 - $7.99 = $2) as an expense, thereby subsidizing users. It’s doubtful that existing users of Spotify/Rdio/etc will be enticed purely by the features of Beats, which might be less expansive (compared to the competition) when Apple’s redesign of Beats goes live. A user of Spotify myself, I’ve been extremely impressed with the latest updates to their apps (ample gesture support, song lyrics, and the overall design aesthetic), and I can’t imagine the first version of Beats to be as fully fleshed out. Although features themselves won’t entice users to switch to Beats, a slightly lower price of $7.99 surely will. Finally, it’s worth pointing out that most of the existing streaming services offer a 50% student discount, effectively making the monthly price $4.99. I use this discount, and I know many other friends who do the same. Beats doesn’t currently offer any student discount, but they will have to if they want to reach the price-conscious college age audience. 

#2 Exclusives

There is a new Kanye West album coming out later this year. What if Beats were able to snag it as an exclusive for the first month, thus having it before all of the other streaming services get it. That would be a very powerful value proposition, and one only Apple can negotiate. Of course Kanye wouldn’t be the only artist Beats would have exclusive rights to — they should negotiate similar exclusivity rights for as many artists as possible. If you knew that your favorite artists new album will only be available on Beats for the first month, you sure as hell would consider switching to Beats. It should be noted that these type of deals are expensive and difficult to negotiate, but Apple has money, and money talks. 

#3 Preinstalled with hardware

Apple has complete control over the hardware and software of its products. Just as the the music app is bundled with all devices, so should Beats. The Beats app should come preinstalled on the iPhone, iPad, Mac, and the Apple Watch. This will serve two main purposes. First, it will cement the brand name. Most people aren’t as familiar with Beats music streaming as the Beats headphones, mostly because the service has done very little promoting of itself. Coming preinstalled with Apple hardware would certainly fix that. 

Deriving from this first benefit of being preinstalled on hardware is the second benefit — increased usage of Beats. If more people are aware of the Beats music service, it is logical to assume more people will use it. Where these users come from doesn’t matter; it may be those uninitiated to any music streaming service, or those switching from Spotify/Rdio/etc. 

#4 First-party advantages

As the software chieftain of its products, Apple can use API’s not available to 3rd party streaming services. You don’t need to search too hard to find miffed developers complaining online about their apps not being able to using the same API’s Apple uses in its apps. These API’s are locked from 3rd parties for safety and privacy reasons, but they allow for many functions regular apps simply cannot do. It’s still not clear how Spotify will work with the Apple Watch, but I imagine the limitations will be plentiful. For one, the Apple Watch comes with 8GB of storage, but only 2GB are available for storing photo’s and music, with the remaining 6GB used to store the OS. Perhaps the Spotify app will be limited to offline storing of only 2GB of music on the Watch. Meanwhile, the Beats app will allow for more, since it will be graced with Apple’s first-party stamp of approval. This is all conjecture, of couse, but you can bet that Apple will use 1st-party API’s to allow for more features that 3rd party apps can only dream of. 

Précis

I have many more ideas for what Apple should do with Beats to make it overtake the other streaming services, but we can leave that novella for a later time. The four strategies I have listed above are the most vital to the success of Beats. So vital, in fact, that I don’t think Beats will succeed unless at least two of the four options will be chosen. Realistically, options 3 and 4 will be implemented by Apple, mostly because they come with no additional costs. I do not think, however, they will be enough to convince people to switch to Beats. To steal market share from the other music streaming services, options 1 and/or 2 should be chosen. They will likely cost an additional few hundred million per year, but I think those costs will be indemnified by the goodwill they generate, and the influx of new, paying users. 

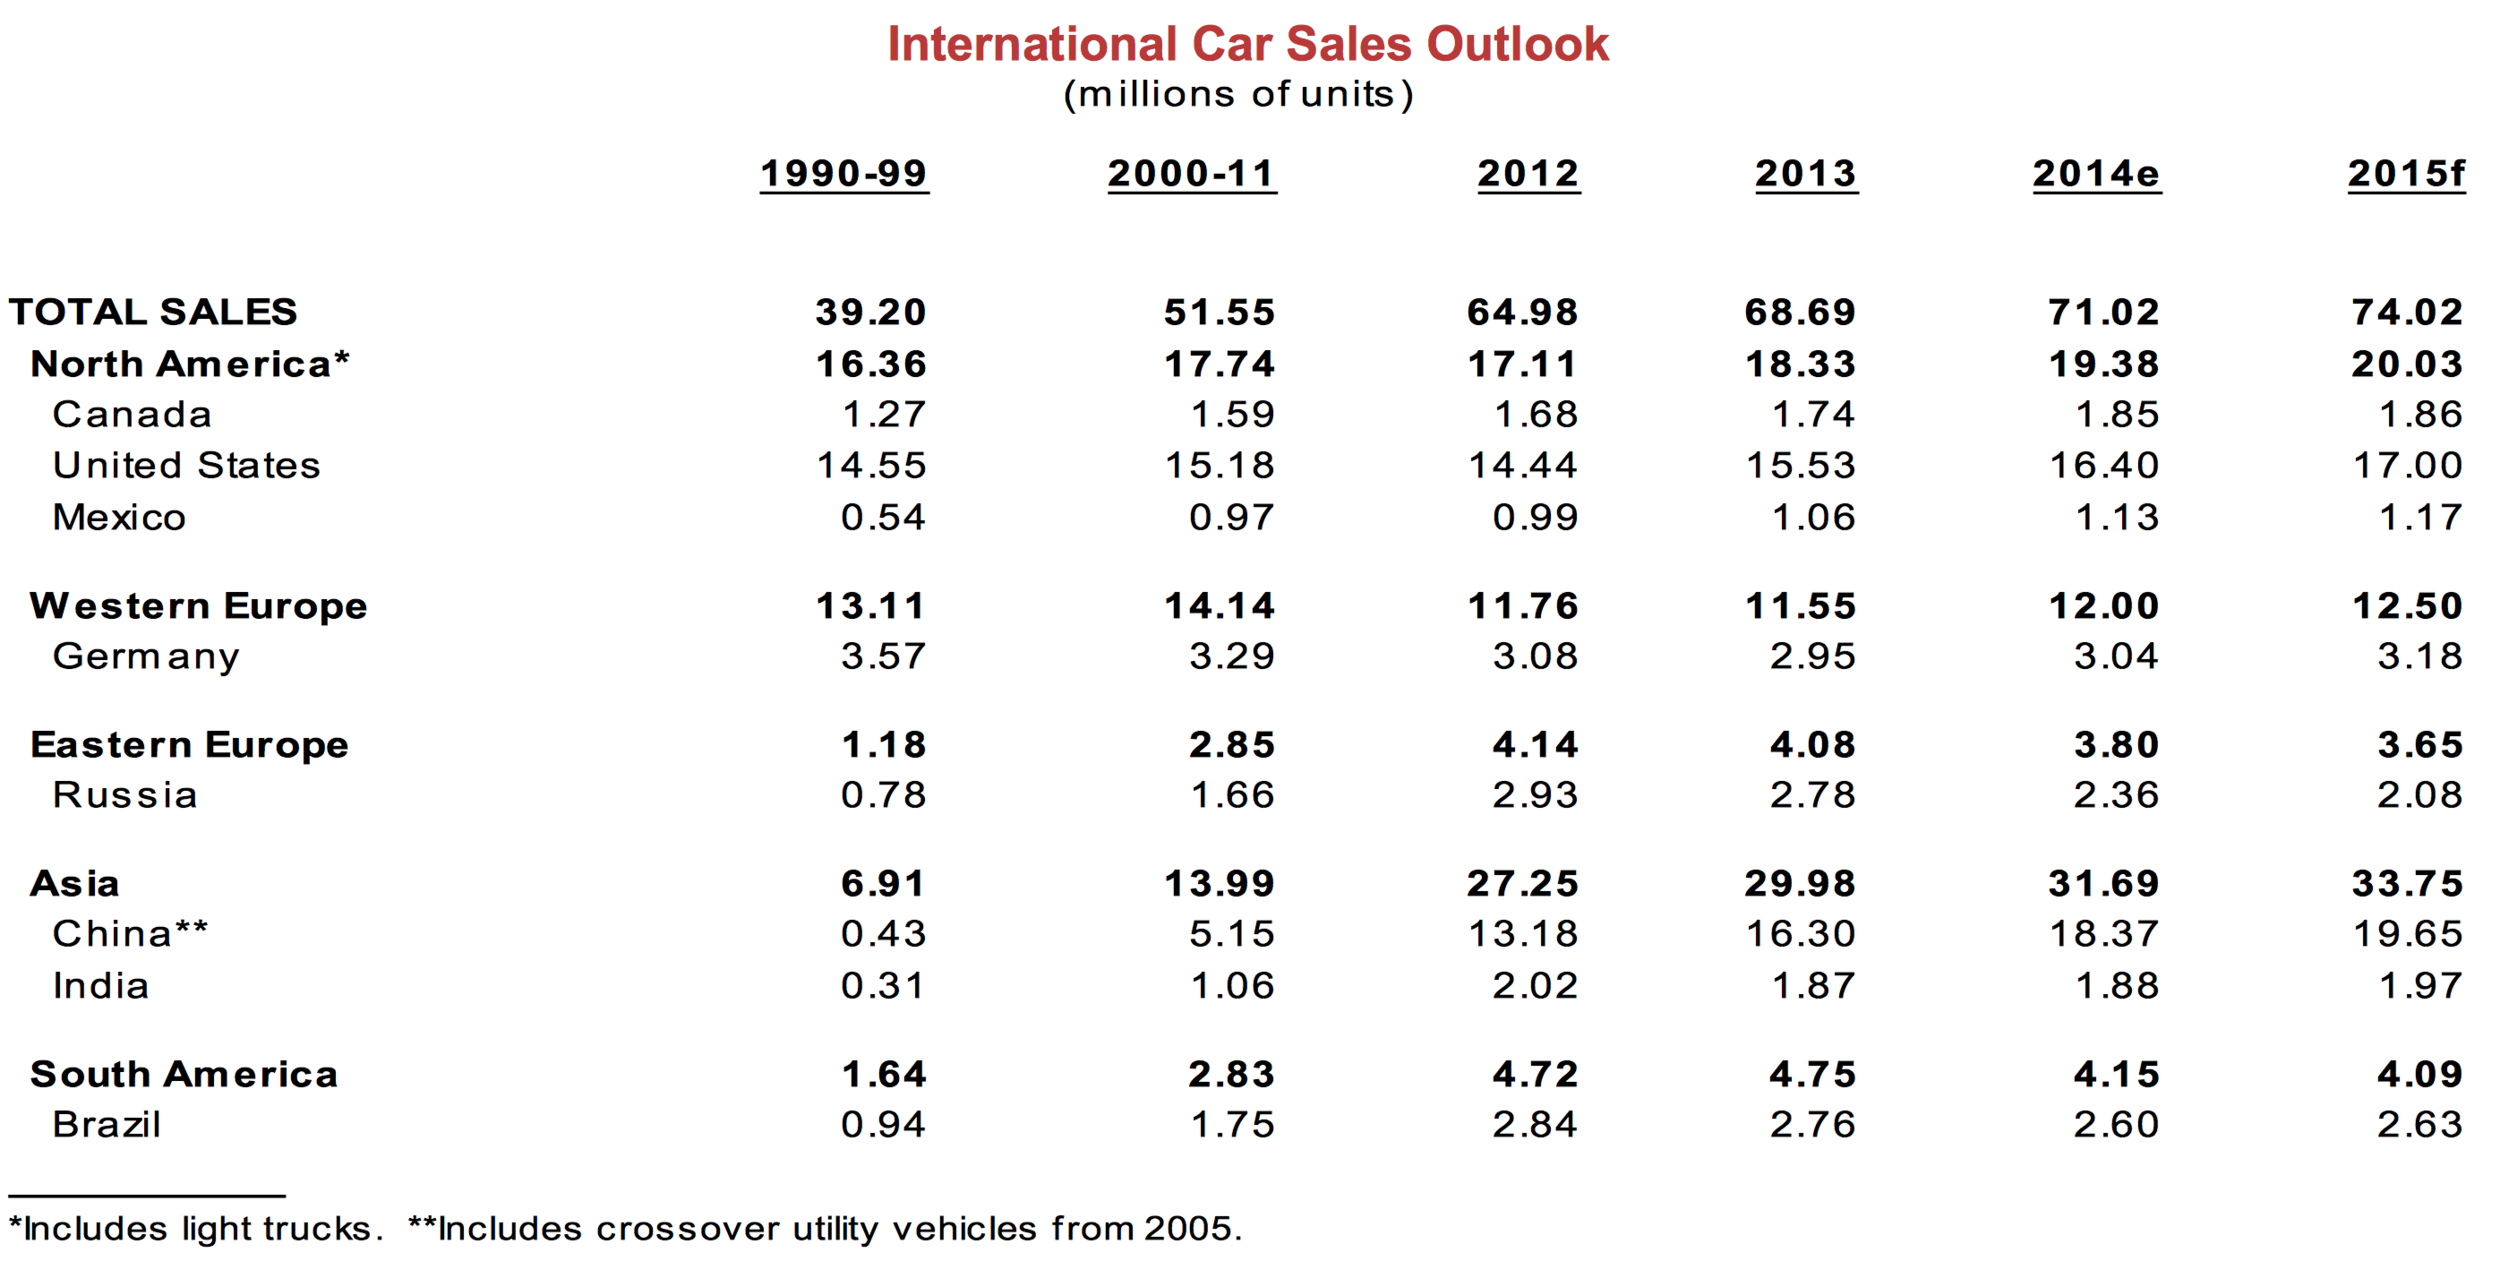
For next week, we will continue our automotive industry discussion by comparing the unit sales of the major automotive manufactures.


If you have anything to add, or just want to share your meandering thoughts about what we covered, please comment below! I’m also very active on Twitter, so don’t hesitate to @lsukernik me!

Automotive Industry Exploration (Part II)

The automotive industry is a huge place, so it is best we tackle it one step at a time. For our first stride, we took a look at the revenues, expenses, and incomes of only a few car manufacturers: GM, Ford, BMW, and Volkswagen. For this next step forward, I have added Daimler, Honda, Toyota, and Nissan to our repertoire of car companies. Let’s take another look at the cost structures of these companies (as compared to each other and Apple), this time with additional companies and a better understanding of the automotive industry. Again, please excuse the slight variations in years, which are due to the different fiscal year end each company uses, and the delay in reporting annual figures. 

Now that we’ve introduced additional companies to the mix, we can see that Apple’s impressive annual revenues of $182B in 2014 are actually dwarfed by the revenues of Toyota ($249B in 2014) and Volkswagen ($241B in 2013). The higher revenues of auto manufacturers have very a simple explanation: a car costs a lot more than a consumer technology device. Therefore, I wouldn’t place too much importance on the revenue figures - they are best suited for comparing the car manufactures to each other, rather than to compare them to the revenues of Apple.

I should also point out that the revenues used for our purposes are consolidated revenues. They include revenues from all of the segments each car manufacturer operates in (cars, trucks, motorcycles, financial services, etc). The revenues we used for our selected car manufacturers also include the income from companies they hold an equity interest in (which is usually other car companies). Unlike the relatively simple financials of Apple, the auto companies are full of incestuous relationships that heavily cloud their financial metrics. 

Though we now know that revenues are not the end-all-be-all, the same cannot be said about gross profit (which is calculated as revenues - cost of sales). Software companies, for example, tend to command the highest gross profit because the cost of producing an intangible good is tiny compared to what you can charge to sell it (think Windows, or Mac OS X before it went free). On the other hand, a car is as tangible as a good can be, and requires copious amounts of materials and labor to manufacture. As a result, the cost of sales for car companies is proportionately higher to that of software, which results in a lower gross profit. Apple is somewhere in the middle of software and cars. Most of Apple’s revenue and cost of sales comes from the hardware products it sells (iPhone’s, iPad’s, Macs) but Apple also makes some money from intangible services like iCloud and iTunes. That is all to say that if Apple entered the car business, its gross profit would look more like what it is for car manufacturers than what it is for Apple now.

It comes as now surprise then that Apple has the highest gross profit out of all the companies we profiled for this analysis. It costs less to make an iPhone/iPad/Mac than it is to manufacture a car.

Restating gross profit as a percentage gives us even more valuable insights into the manufacturing intensity of Apple vs. the auto companies. To calculate how much each company keeps for every $100 of revenues, just multiply $100 by the percentage in the above chart. For Apple, that would be $100 x 39% = $39. For Honda it would be $100 x 26% = $26. -

You can see that the luxury auto brands have higher gross profit percentages, while the American car companies have the lowest (no wonder many went into bankruptcy!). Tesla has a gross profit percentage of 28%, Daimler (Mercedes) of 22%, BMW of 20%, and Honda of 26% (Honda does have a luxury brand (Acura), but the disproportionally higher gross profit is probably attributable its to operational efficiency).

Apple is well known for its operational efficiency (it has the highest gross profit percentage out of all smartphone manufacturers). But how well would this efficiency transfer to the manufacture of cars? I would venture to say that if Apple made a car, the margins would be slightly higher than those of Tesla, or around 30 - 35%. This would translate to much higher margins than what traditional car manufacturers are used to, but lower than what Apple is used to.

Non-finance people usually despise discussing margins since they have nothing to do with the product itself. Despite my rather traditional accounting background, I also tend to favor looking at the product instead of its profitability. But margins are helpful to understand because no reasonable company would enter an unprofitable business. If Apple’s research labs find that their is little money to be made in cars, it is doubtful we would see any Apple Car released at all. Before billions of dollars are spent on R&D, someone at Apple Finance needs to give the go ahead, which will only happen if there are profit margins to be made. Of course it is possible that Apple will develop a car with shockingly high margins (>40%), but I think it would have to be assembled from thinly cut paper for that to be true. 

The mother of all financial metrics is net income, which lets us know how much a company has left over after all expenses, interest charges, taxes, and “extraordinary” items. Net income is the holy grail of business; it is why investors invest, and what a company wants to attain in order to be successful. It can be used to pay dividends to investors, it can be reinvested into the company, or it can simply be stashed into retained earnings. As you can see from the chart above, Apple made around $39B of clean, unadulterated income.

Just to put things in perspective for you, here’s something to ponder about: Apple had a higher net income in 2014 than the combined net income of GM, Ford, BMW, Volkswagen, Daimler, and Honda (I would include Tesla too, but it posted a net loss of -$294M in 2014).

Now, you might ask - why would Apple get into the car industry if there is little profit (by Apple’s standards) to be made? After all, it’s doubtful that Apple would be able to sell as many cars as all of those automakers combined, and even if it could, Apple’s net income from car sales would be lower than its income from technology products. To play devils advocate, you can argue that if Apple were to assemble cars, its operational efficiency would keep margins high and thus allow for a higher net income. This is certainly a plausible scenario, but how many cars would Apple have to sell to reach even $1B in net income? The answer to that question remains a mystery, but hopefully for not much longer, as we will dive into automotive unit sales soon. 

Takeaways

Just as with the first automotive industry exploration, we are left with more questions than answers. That doesn’t mean this post wasn’t worth writing, however. We learned that car makers have ballooned income statements; exceptionally high revenues, and exceptionally high costs. We also learned that automotive margins are fairly low, especially for U.S. carmakers. As a result of their cost structures and the nature of the industry, the net income’s of car companies are paltry compared to that of Apple. In order to make money in this industry, you have to be extremely efficient, which, fortunately for Apple, it is known to do. 

Undoubtedly, there is a sizable team of finance/accounting/operations employees at Apple that are doing the very same market research as we are here. Their data is likely to be much more comprehensive and detailed, but I can’t imagine the results to be far different from ours. As we continue our exploration, we will learn more about the business of making cars, but for now, it doesn’t look like a great business for Apple to be in. Revenues are high, but profits are low (we should note again, low by Apple’s standards). It is still way to early to have any conclusive thoughts, but who says we can’t have opinions!

What If 

You can probably tell from all of the data we have analyzed thus far that the traditional car market isn’t the most appealing business to be in. But what if Apple totally changed the game? The current production system for cars is arduous and expensive - but does it have to be that way forever? What if the margins on cars were dramatically higher? Or what if the use-case for cars were expanded or altered? At the moment, the driving age in most jurisdictions in the United States is 18. But cars are expensive, and most teenagers are forced to use their parents’ car rather than to purchase their own. Suppose, however, that Apple is able to cheaply manufacture tiny cars (work with me here) that cost under $5,000 and take no gas. All you need is a battery charger. How many parents would buy their teens a car now? 

To stretch things even further, let’s make these cheap Apple cars self-driving. Instead of having to drop your kids off at school or have them take the bus every morning, you could just pack your child into these small autonomous self-driving vehicles. And if you’re thinking this sounds very sci-fi, you’re on the right track. If we are to believe Apple is making a car, and that automotive profitability is quite low, something else should be going on, and spreadsheets alone won’t help us find it. 

In future posts, we will be taking a look at automotive unit sales, break-downs of revenues by brand (Volkswagen vs. Audi, Toyota vs. Lexus), and a much deeper look into the electrically charged darling, Tesla. 


If you have anything to add about the automotive industry, or just want to share your meandering thoughts about what we covered, please comment below! I’m also very active on Twitter, so don’t hesitate to @lsukernik me!

Slide Gallery

Automotive Industry Exploration (Part I)

It is no secret that I am fascinated by Apple and the technology industry as a whole. I have written amply about Apple and the neighboring technology industry for the past few years (and have read about them for almost nine years now). When news broke that Apple was working on a car, my Twitter timeline was evidence of my not knowing of what to think. Although I don’t follow the automotive industry as closely as tech, I am a fan of cars and car design. I know when the new car models are released, what they look like, and what features have improved over the previous models. What I don’t know, however, is how the automotive industry operates (who are the suppliers, what materials are used, and so on), who the key players are, what the market share of each key player is, competition in the industry, and how profitable the automotive industry is in general. When I began following the technology industry, I didn’t know any of the above questions either, but through time I developed a thorough understanding. It is now time for me to develop an understanding of the automotive industry, which seems ripe for disruption

If you’re reading this, I imagine you are in a similar boat to mine; you follow the tech industry closely, and have a newfound interest in cars after the recent Apple Car rumors. In the next few months, I will starting delving into the auto industry (in addition to the usual tech posts I publish) to gain a better understanding of it. Some questions I want to answer early-on are: what would Apple gain from entering the car market, how much profit is in selling cars, and what are the unexpected consequences of entering a wholly new market (in addition to many other questions). So sit down, buckle up, and enjoy the ride.

Global Car Sales

Global Car Sales
  • Scotiabank published a great report on global auto sales, and it is as good of a place to start as any. In 2014, a total of 71M cars (includes light trucks) were estimated to be sold around the world. For comparisons sake, Apple sold 74M iPhone’s during the last quarter. Obviously a car is a much more expensive and thoughtful purchase, but hopefully you notice the great disparity in scale between the tech and the automotive industry on a unit basis.
  • Most car sales occurred in Asia (32M), North America (19M), and Western Europe (12M), followed distantly by South America (4M) and Eastern Europe (3.8M).
  • 2015 forecasts have global car sales increasing by 3M to 74M, which implies a 4% growth rate. It appears the automotive industry is not a growth market by any means (feel free to prove me wrong).

Automotive Industry Profitability 

I chose some of the better known car manufacturers for this next chart, just to compare them to Apple. Academically, it is wrong to compare a company in one industry (tech) to another (auto), since two the industries are different in almost every regard. That said, doing so establishes a nice sense of scale which can help us understand the relative sizes of the companies. It may also help to answer why Apple may be interested in making cars in the first place.

Revenue and Cost of Sales
  • In terms of yearly revenues, Apple is second only to the Volkswagen Group, which is a holding company that owns brands such as Volkswagen, Audi, Bentley, Bugatti, Lamborghini, and Porsche. It is also worth mentioning that the revenues included in the above chart are comprehensive, meaning that they include the revenues not only from vehicle sales but also from the financial arms of the automotive companies. I did this deliberately because if Apple got into the car business, they would presumably get into the leasing business as well. Also note that I used the 2014 figures for Apple, GM, and Ford, and 2013 figures for BMW and Volkswagen. This is because the annual reports for the German car companies weren’t released yet. I doubt the 2013 figures would differ materially from the 2014 ones, though.
Gross Profit
  • Apple had by far the highest gross profit out of the companies in this comparison. You would assume that automakers make boatloads of profit on each car they sell, but the data says otherwise. The costs in selling a car are not much higher than the costs involved in making one.
Gross Profit Percentage
  • In terms of a gross profit percentage, Apple is the victor once again. For every $100 in revenues, Apple keeps $39. For every $100 the car companies make, GM keeps $11, Ford $14, BMW $20, and Volkswagen $17 (this is before any operating expenses, taxes, and interest charges). Although I did not include Tesla in this analysis (it deserves its own analysis, which will come later), you might wonder what its gross profit percentage is. By my calculations, it’s 28%, meaning that Tesla gets to keep $28 per $100 of revenues, which is the highest gross profit percentage out of all the other car companies compared in this analysis.
  • It doesn’t take a genius to see that manufacturing cars is an expensive business. If Apple entered the auto industry, they would either have to get used to lower margins, charge higher prices to offset the cost of sales, or lower manufacturing costs. That is a difficult problem to solve - no wonder Apple is on an automotive hiring spree.
Net Income
  • The culmination of all the above information leaves us with the net income of each company. As you would expect based on what we learned previously, Apple had the highest net income out of all of the car companies. Not only is it higher, but Apple’s net income in 2014 is 1.5x higher than the net incomes of GM, Ford, BMW, and Volkswagen combined. Apple’s calendar year ends in September, mind you, and the data from BMW and Volkswagen is for 2013, but the size of Apple’s profits is still mind-boggling.

Early Thoughts

While the above analysis was rudimentary and not enough to paint an accurate picture of the automotive industry, it is a good start at understanding the size and profits of the automotive industry. In a nutshell, here’s what we can takeaway:

  • Even if Apple made a successful vehicle, it is highly unlikely the car business would be as large as the iPhone business. Apple sells more iPhone’s in one quarter than all car companies combined sell cars in a year.
  • Making cars is extremely expensive. The price you pay for a car isn’t far from what it costs a car manufacturer to make one. We will delve into the profit margins of luxury vs. base cars in a later analysis, but as a whole, cars don’t have the best gross margins. They definitely don’t come near the gross margin percentages Apple is used to.
  • The key element in the manufacture of cars is suppliers. Essentially all car manufacturers purchase parts from hundreds of different suppliers. Apple would presumably have to do the same (they so for their current products).

Slide Gallery


Twitter and the Pursuit of Revenues

What happens when you cannot find new customers to sell your product to? Usually, you will try to squeeze out as much money as you possibly can from your current customers. That is precisely what is going on at Twitter HQ. 

During 4Q14, Twitter added 4M users. During the year 2014, Twitter added 47M users, which brings the total monthly active users (MAUs) Twitter has to 288M. If you’re a heavy Twitter user, you probably love the service and can’t imagine living without it. If you merely like Twitter, you probably use it occasionally whenever you have some downtime. This brings us to the average Twitter user: they made an account to try Twitter, but never came back; either because they didn’t like the service, found no use for it, or as I’ve written many times before, found Twitter confusing. 

So now we know that Twitter has a user growth problem, and for reasons above, the company can’t seem to get users to stay and use Twitter. We will circle back to MAUs later, but first let us check in with Twitter’s financials. You would think a company that isn’t gaining traction with the users is also not making much money, but you would be wrong. Before I begin discussing revenues, let me preface this by saying that Twitter is an extremely young company (it went public in November 2013), which means that there isn’t a large collection of historical data we an analyze. While that makes the job of the analyst harder since he is working with so many unknowns, it is invariably more interesting! 

Revenue Growth

Revenues increased 33% QoQ, and 111% FY14 vs FY13. Whatever Twitter is doing to get more advertising dollars, it is working splendidly. The company now earns roughly half a billion dollars every quarter. It is still a tiny business, but the way Twitter has been able to grow revenues is impressive. Twitter expects to earn $440-$450M in 1Q15, which is a slight decline from this past quarters’ performance ($479M). 

The first few years of a company after an initial public offering are always a mess, especially in terms of expenses. Usually, formal processes for expenses are not set up yet (employee credit cards, traveling costs, etc) and budgets are either nonexistent or valueless, since everything is constantly in flux. The company is tackling bigger issues such as growth and product, which makes the expenses side of things of secondary or tertiary importance. For these reasons, it is not fruitful to dive deep into the expenses of a young company such as Twitter - they’re not indicative of future trends. 

There are some interesting things going on in Twitter’s expenses, though. R&D, as a percentage of revenues, has been diminishing for the last year. I believe this is happening because management feels the opportunity cost of investing in R&D is too high. Instead, that money is being spent on Sales and Marketing (S&M). Twitter spent $0.43 on each $1 it made on S&M in 2014, which would be an atrocious statistic if not for the immaturity of the company. 

Twitter has never been profitable, and will likely continue posting net losses in the immediate future (1–2 years). You can look at Twitter’s net losses in one of two ways. As an investor, you should be risk-averse and be highly skeptical of Twitter’s ability to post a profit. Social networks come and go, internet bubbles burst and pop, but you aren’t going anywhere. Would Warren Buffet hold Twitter stock? Probably not. The alternative viewpoint you can take on Twitter is that you truly believe in the product and see it as an unbridled social network that advocates the freedom of information, or some other noble or cool pursuit. You may believe that Twitter represents freedom, and the profits will certainly come later, leading you to invest in the company despite continuous net losses. Which viewpoint you choose is a personal question, but now you are armed with the facts. 

If we take all of Twitter’s revenues and expenses, and spread them over MAU, we will get two rough estimates of profitability: total revenue per user, and total cost per user. Although MAU may not be the best metric to use as the denominator, it is a more accurate representation of per-user profitability than “timeline views”, which is the other metric Twitter provides. 

Unlike other analysts, I included all sources of revenue (advertising & licensing) as well as all expenses (cost of revenues, research and development, sales and marketing, and general and administrative) to compute per-user costs, because they provide the most comprehensive picture of profitability.

With that said, you can see for yourself that the total cost per user of running Twitter is higher than the total revenues - by approximately $0.34 per user in 4Q14. That is - Twitter is losing roughly 34 cents for every user of the service.

In Short

Given that Twitter is still such a young company, it is difficult to evaluate its performance in financial terms, since the expectations aren’t set yet. Twitter’s user growth, however, is a different story. MAU are not growing as fast as investors, and more importantly Twitter, would like to see them grow. Twitter probably has one more year to figure things out before investors start to really get antsy. As I’ve made abundantly clear before, the first problem I would tackle would be Twitter’s onboarding process, which remains a confusing mess. Twitter remains my favorite social network, and I remain rooting for the little blue bird even if it’s learning to fly very, very slowly.

Microsoft and Cool

Growing up in the 1990's and the early 2000's, I recall Microsoft being the omnipresent company making Windows and thriving off its enterprise business. There was nothing remotely sexy about it. Even at a young age, I found the design of Microsoft's software to be stale and unimaginative, catering solely to function. Being raised in an immigrant family with little discretionary income, all I had to play with were old Windows PC's that were hand-me-downs from various friends and family members. My fascination with tech started with Windows NT, followed by Windows 95, Windows 98, and finally my last version, Windows XP. It was shortly before the release of Windows Vista that I had all but abandoned the Microsoft ecosystem, and turned to Apple.

There wasn't anything in particular that made me switch to Mac OS; it was a combination of many small deal-breakers that together made for a very frustrating Windows experience. First there was the bloatware that came preinstalled with practically every PC. Then there was the general disregard Microsoft had for aesthetic. Before I bought my first Mac, I never used OS X before, but I always found it to be more appealing from the screenshots I had seen. Moreover, Windows was never playful, and it always felt like it was made primarily to please enterprise. That's because it was.

Things began to improve with Windows 7, but it was the Windows 8 design language that finally made Microsoft value design and appeal. Although Windows 8 was a colossal failure, in my eyes it was what solidified the shift of Microsoft. I still do not know exactly where Microsoft is shifting, but it feels like the right direction.

If you've followed me on Twitter these last few weeks, you would know I called Microsoft out for its purchase of Accompli Mail and Sunrise Calendar. I have since changed my thinking. My mistake was in assuming that the goal of both purchases was to eventually turn a profit from these apps. This line of reasoning was reinforced by the constraints of my business school education: a company buys another company when it believes the return on that investment will exceed the return of the next best investment. You already know I'm a big fan of examples, so let me illustrate my previously faulty logic.

Let's say you own a company and have $1B of unused cash lying around. It would be foolish to keep it locked down at a bank, since the interest rate you would be earning would be negligible. Instead, you can invest it in the stock market and earn roughly a 10% return every year, or $100M. Alternatively, you can invest the $1B in the R&D of a potentially new product, which by your estimates will earn $500M in year 1, $800M in year 2, $1B in year 3, and $1.2B in perpetuity. Financial analysts would discount the cash flows of this potential project in year 1, 2, 3, and so forth, in order to calculate the total return of this product. If the return is greater than the original $1B investment, it may make sense to invest in this project. But what you really want is for the total return of this product to exceed the return of the next best investment, which is the $100M you would earn from the stock market. Of course, this example is a simplification of reality, but hopefully the point is made.

Using this logic, I assumed that the rumored price of $200M that Microsoft paid for Accompli, and the $100M they paid for Sunrise, that they would expect to earn a greater return than the cost of the investment. In other words, I implied that Microsoft believed that the $300M they spent on these acquisitions would provide a greater return than the cost. This thinking was largely incorrect.

It was incorrect because my assumptions were all wrong. I assumed that the goal of these acquisitions was for Microsoft to make money on them over the future years. After all, why would you spend millions of dollars on something that won't actually make you any money? Given this assumption, I reasoned that Microsoft will not actually make money on these products, since few people would be willing to spend money on an email or calendar app. Microsoft was paying millions of dollars for two apps that won't actually bring them any profit in!

For as much writing I do about the inability of spreadsheets to calculate the complete financial ramifications of a business, I still made the same mistake that many analysts do. In reality, Microsoft was investing not in the profitability of Accompli and Sunrise, but it was investing in the future of Microsoft.

Goodwill is what accountants and financial analysts use as a plug-in variable for everything they can't measure. It is fairly easy to asses how much the laptops, desks, and other equipment of the business are worth. The same goes for the liabilities of a business. But the worth of intangibles such as patents, logos, employees, brand recognition, and customer data is as close to the definition of guesswork as can be. We simply don't know how to put a concrete value on such touchy-feels things. There is no Craigslist for intangibles, and so we do not know their exact worth. What we do know is how much we are willing to pay for them. Accounting students spend a whole semester learning how to calculate goodwill on an acquisition, but in general terms the calculation is very basic. Goodwill = what you paid - what something is worth. If you paid more for the business than it is worth, you have goodwill. Congratulations - you now know more about goodwill than 99.99% of the population (and probably more than most accountants)!

Understanding the concept of goodwill, we can return back to Microsoft and its latest two acquisitions.

As I have alluded to earlier in this post, Microsoft was actually purchasing the intangible element of coolness when it acquired Accompli and Sunrise. Microsoft was also purchasing relevance, social, and trendy. Although it may seem insane for a company to spend hundreds of millions of dollars on such vague and immeasurable terms, these are actually investments that aim to convert Microsoft from being an enterprise dinosaur to a modern creature. Most of Microsoft's success in the past came from what its users did at work: Outlook for email, Microsoft Office for documents, SharePoint for collaboration, and Windows for the ecosystem. But when these users came home, they used consumer-grade products from Apple and Google since the user experience was better, and many features were free. As a result, Microsoft's blinding focus on enterprise lost many consumers to non-enterprise software.

Accompli and Sunrise are acquisitions to win back these non-enterprise users. Although Accompli is heavily geared toward productivity and scheduling, it is a well designed (but by no means perfect) app that also caters heavily to non-business users. By purchasing it, Microsoft was able to please enterprise users by offering them a great iOS mail application and please consumers by providing them with a great general email application.

Sunrise, a calendar app with social integration (Facebook, Foursquare, etc), is Microsoft's attempt to please consumers even further. Before the acquisition, Sunrise had millions of users. Now they belong to Microsoft. It is possible, of course, that Microsoft will lose these users through bad updates to the app, but I remain confident this will not occur.

So where exactly is Microsoft shifting - to consumers, enterprise, or both? My bet is on both, judging from the recent acquisitions. But what is most promising to see is the newfound focus on design and cool by Microsoft. For a company that never prioritized these two attributes, it is impressive to see them pivot so quickly. With both acquisitions, Microsoft purchased a huge cohort of younger users (like me) who have previously abandoned Microsoft products or have never used them before. If they don't mess up, there could be another generation of Microsoft users.