Chart Dump: Apple 2Q15
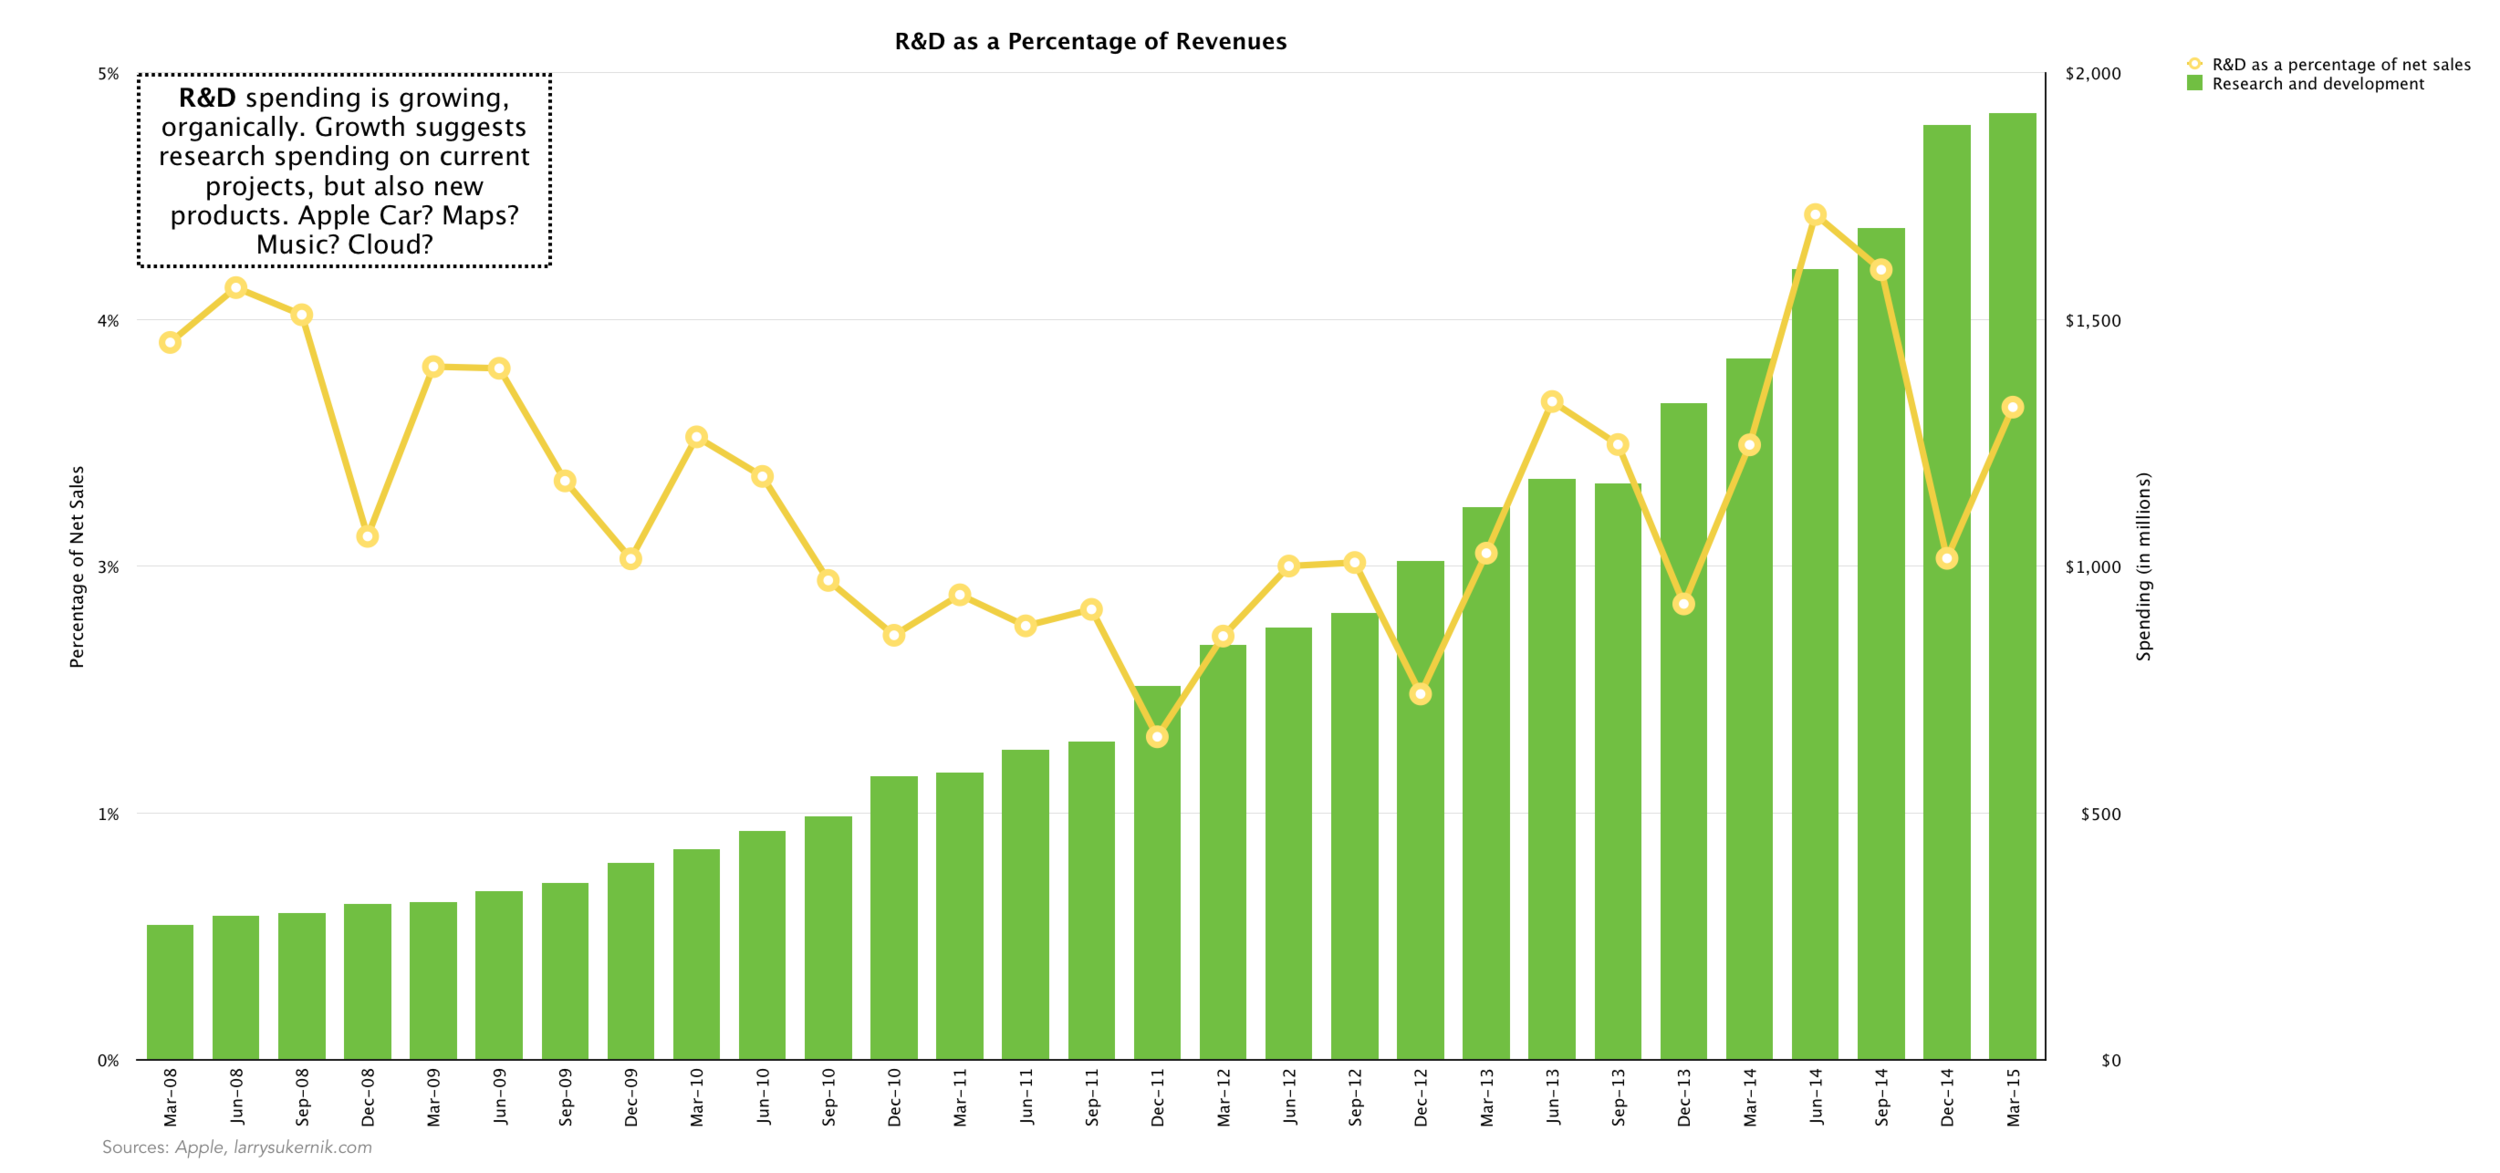
The charts speak for themselves - another great quarter for Apple!
The charts speak for themselves - another great quarter for Apple!
Lending Club, which is a peer-to-peer online lender, had an IPO this Thursday, December 11. After a full day of trading, shares closed at 56% above the initial IPO price. As often happens, many vociferous investment banking haters called this an IPO "pop", in which the banks stole millions of dollars from the company.
The truth is IPO's are a messy ordeal, and are full of estimations and guesswork by the bankers. Perhaps nobody can better explain what really goes on during an IPO than the notorious Epicurean Dealmaker. Here's an excerpt from the fabled Wall Street philosopher:
Now, you can see that this exercise is an art, not a science. Investment bank IPO pricing is the epitome of (very) highly educated guessing. We often get it wrong, but, on average, IPO pricing is normally pretty accurate. After all, it's our job, and we do it well. The picture gets complicated, however, when the company in question, like LinkedIn, does not have any comparable peers among listed public companies. Our guesses become much less educated and much more finger-in-the-air type things. There is no cure for this but to go to market and see what investors themselves tell you they are willing to pay.
For a thorough explanation of this sensitive topic, I recommend you read his full post on LinkedIn's IPO pop. The very same logic could be applied to last weeks Lending Club offering. Occam's razor taught this concept to us hundreds of years ago, so let's not blame the banks for the behavior of the market.
Startups are extremely popular today, since the Internet and the post-PC era have allowed small companies to reach an audience of billions. Everybody carries a smartphone with them, which gives the potential access to your new idea to users. Assuming your startup idea is good, you can really hit it big. We have seen this happen to Facebook, Twitter, and Snapchat, who grew (and continue to grow) users at levels retail businesses would kill for. By the way, these services are free.
After reaching such a large audience, these social media companies require money to pay for the cost of doing business, which they first get from investors in angel rounds. The investors, in return, expect to be paid back more than their initial investment. Thus, a social media company (and all companies that require investment, really) must somehow start producing revenues and hopefully profits to pay their investors back. Since their service is free, online advertising has been the only way to generate these revenues. The way online advertising works is the more users see or click the ad, the higher revenues a social media company will get. Key performance indicators (KPI’s) such as monthly active users (MAU’s) are used to calculate a valuation on many such advertising companies.
As I’ve written in the past, these new valuation techniques are extremely young, and their results are to be taken with a grain of salt. My favorite view on this issue is from Aswath Damodaran, a finance professor at NYU Stern. His take says there are currently two major ways to valuate social media companies. The first is from the traditional investor, who looks at revenues, profits, and investments. The newer valuation technique looks at user growth and other user-focused metrics like MAU’s. He argues that as a company matures, it must transition from telling stories to showing meaningful results. These results are mainly focused on the fundamentals of business, like revenues and profits.
As a social media company grows, the way it is valuated shifts from the younger model, to the older, traditional model. Most of the successful social media companies are still too young to fully appreciate this valuation shift. In fact, most investors will probably shift their techniques unknowingly. They will notice how social media companies are maturing, and begin applying the traditional models. Stories will no longer be enough to take investor’s money, and results will have to be shown.
If you've been reading this blog lately, you will notice my interest with Spotify. It's a relatively young company, and not much data is available online about it. For the past week, I have been trying to figure out the growth rate of paying Spotify subscribers, which I have finally calculated. It has been difficult mainly because Spotify doesn't announce growth numbers every month. Fortunately, I found data online to have enough numbers to work with. Below is a table I have created listing the date and and paying subscribers that Spotify has publicly announced. I calculated the number of days and the growth percentage between the dates, and then multiplied them by 30 (number of days per month). This gives us the a very rough growth rate of paying subscribers per month, which we can use to predict future subscribers.

As you can see, the growth rate per month (from now on just growth rate, since it's shorter to type) varies from a high of 18% in November 2011 to a low of 4% in November 2014. These numbers are deceiving, as they calculate the growth between two unequally distant periods, divided by the days between those periods. Some months may have had higher rates of growth due to well-placed advertisements, entering new markets, or just fortunate word of mouth. What these calculated growth rates did was give us a ballpark figure, since no other data was available online. So now I knew the approximate rate of growth, and now I needed to check if I was on the right track. I did just that. I had the data Spotify announced in March 2013, as well as the number of subscribers in May and November 2014. If my rate of growth from March 2013 was correct, I would be able to multiply the paying subscribers by the growth rate and come up with the actual data Spotify announced.
The first growth rate I tried was the one from May 2014, or 4.69% per month. If this was the correct rate, I could calculate 10,000 paying subscribers for March 2014 and 12,500 in November 2014. Here is what the 4.69% growth rate got me.

10,400 users in March and a whopping 15,000 in November - Spotify wishes! This told me that my calculated 4.69% rate was too high, and I had to adjust it down. Next, I tried the most recent rate from November 2014, which was 4.08%. Again, here's the calculation.

9,695 users in March, and 13,350 in November. Again, I knew I was off. The rate per month was actually higher leading up to March, and much lower from March to November. My goal wasn't to calculate the growth for each month (that is impossible, since I don't have enough data to work with), but rather, it was to calculate the approximate growth rate per month between the periods of March 2013 and November 2014. Since 4.08% was too high, I knew I had to adjust it further. I kept adjusting the rate until I came up with 3.738%. That is the average growth rate that the Spotify paying subscriber count kept growing at every month. Again, it's worth reiterating that this is an approximate rate, and some months grew much faster than others. As you can see below, my calculations almost perfectly matched the data provided by Spotify for March and November 2014. For March, I got 10,030, when the actual number was 10,000 (Spotify likely rounded this number, so my calculation may be perfectly precise). And for November, my calculation was precisely right - 12,500 - just what Spotify announced.

This rate of 3.738% is useful for many reasons. Foremost, it will allow me to predict subscriber counts in the future with a reasonable accuracy. With that, I can finally begin to put a value on Spotify as a whole. This analysis was mostly numerical. With the calculated data, I'll be able to dig into the real meat of the story, which is how Spotify can grow, strategies to do so, the operations underlying those strategies.